11 Data Analytics
Data analytics is the process of discovering, interpreting, and communicating insights that are meaningful to the firm from patterns observed in massive amounts of data. In other words, analytics uncovers information that is hidden in the data and that the firm might never discover if it were not for analytics methods and technologies. When analytics is in the context of a business vision and serves the specific goals of a firm it is also known as business analytics.
The data itself has little meaning and adds no value to the firm. Firms could try to collect all the data in the world and dedicate unlimited resources to store it, but unless they do something with it, treat it, organize it, and process it, all the effort will be wasted, and they will never recover their investment. Fortunately, advances in analytics technologies are creating new opportunities for tourism firms to capitalize on their data and act on the insights it provides. Modern analytics techniques are increasingly advanced and sophisticated and allow firms to explain not only what has happened through descriptive techniques, but also to carry out predictive analysis that anticipate what could happen, self-learn and self-adapt to changes in the environment to uncover hidden patterns in the data, and answer key business questions. These tools are becoming more intuitive and easier to use, even without being an expert or having advanced knowledge of mathematical methods and statistics. They also incorporate powerful visualization capabilities that allow millions of data to be interpreted in an instant. They are also mobile and allow business owners and managers to see data signals anytime, anywhere, before their competitors.
These advances represent an enormous potential available to tourism firms to improve business management. Firms can now “talk” to their data and trust it to make more informed decisions that help increase sales, reduce costs, and deliver speed and simplicity to customers. Understanding what data analytics is about and implementing an analytics framework integrated with Big Data is therefore a critical step in any smart transformation strategy.
11.1 The Data Analytics Workflow
Data analytics is about capturing and processing historical data that affects the business, analyzing that data to identify patterns, trends, and causes, and making decisions based on the insights generated. Therefore, it is a top-down approach made up of many data-intensive components that must work together to generate the answers the firm is looking for.
Although data analytics tools and technologies process data and create knowledge through reports, graphs, and other visualization tools, they cannot solve the problems of data warehousing, data searching, data sharing, or realtime analytics. They also need the right infrastructure in place to incorporate that data. Furthermore, the practical application of the insights generated on the behavior of tourists to something that is useful for the business it is especially challenging for any firm considering that data analytics and business intelligence applications are still rare in tourism firms (Mariani et al., 2018). These capabilities will need to be enhanced as firms increase their capabilities to collect real-time tourist data (i.e., through mobile devices, social media, platforms, websites, vendors, etc.) and seek to track travel patterns in a more effective way.
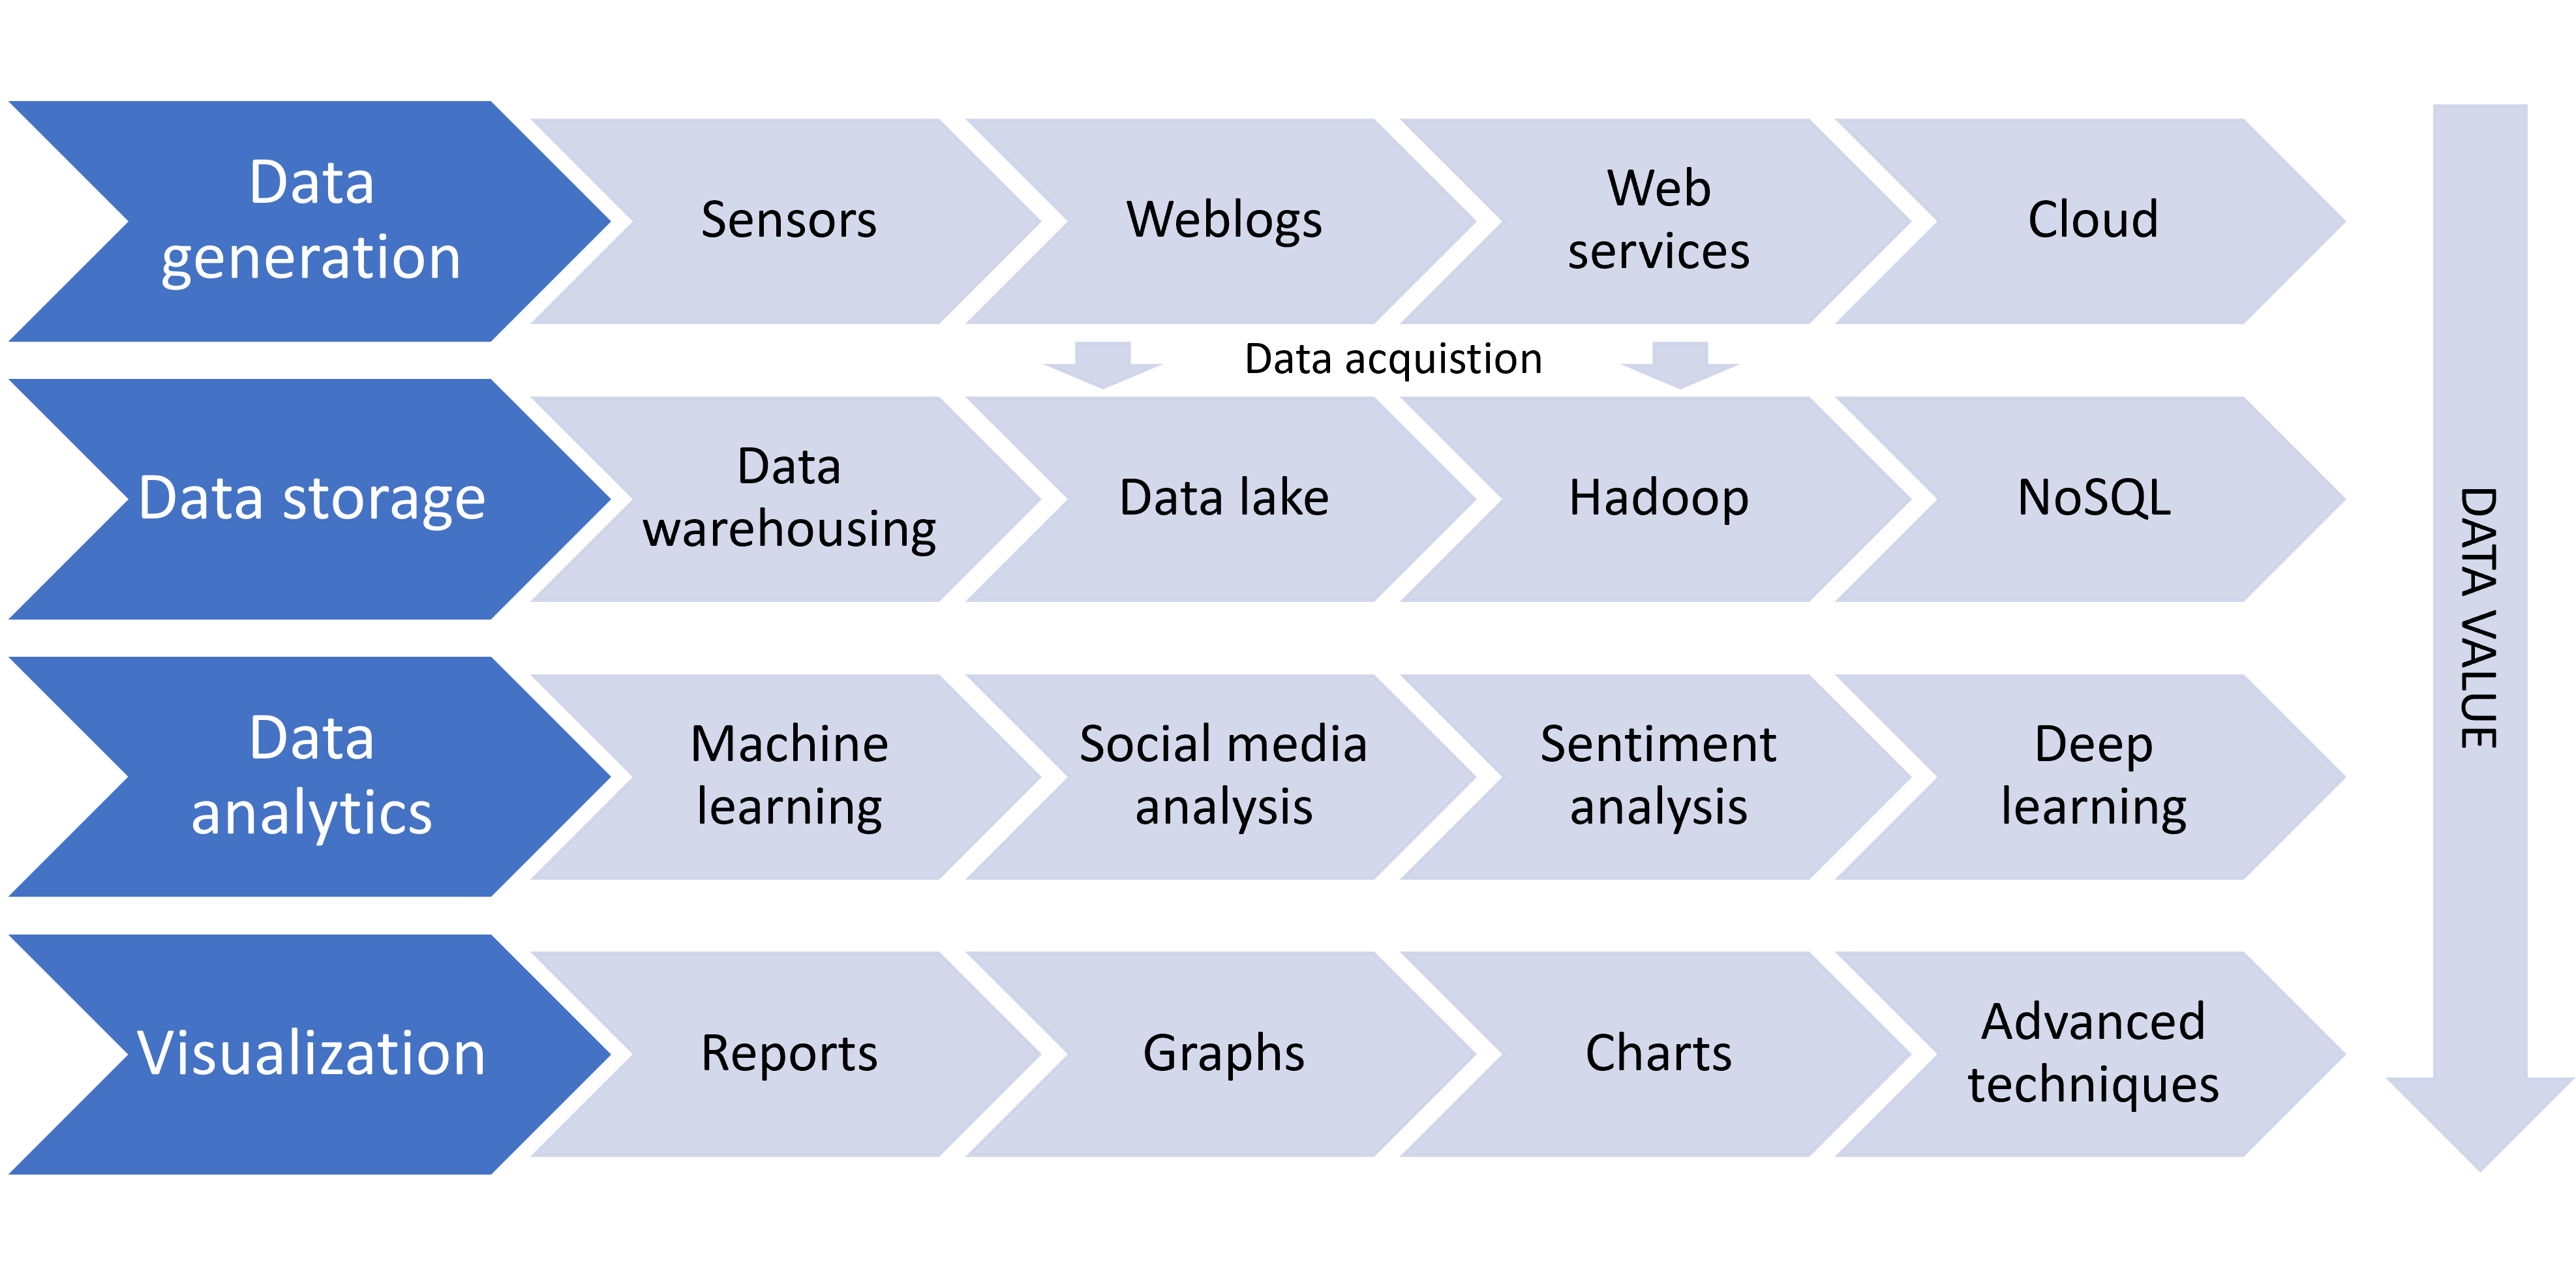
The integration of data analytics and Big Data management provides the processes, infrastructures, methods, and technologies required for effective and efficient data management in modern smart organizations. Both are increasingly critical capabilities for tourism firms around the world as they manage increased volumes of data and address smart transformation. Typical components that are part of the data analytics workflow are shown in Fig. 11.1.
Data collection/generation: As the data that feeds data analytics comes from very diverse sources (e.g., spreadsheets, databases, mobile applications, social media, Internet of Things (IoT) devices, etc.), it is necessary to start by grouping and storing them in a centralized repository so that people can access them later. There are multiple options for storing data: in some cases, data is stored in data warehouses or data lakes, in other cases, cloud databases are used.
Data storage and mining: Once the data has been collected and stored, the firm must classify, order, and process it. At this stage, it is very useful to use machine learning algorithms because they help to quickly recognize patterns and execute repetitive actions at high speed (e.g., setting metadata), allowing data scientists to focus their attention on exploiting the information instead of wasting their time on repetitive manual tasks that machines can do more efficiently.
Data analytics: It can be descriptive or predictive. The first tries to answer the question “what is happening” and “why is it happening” and helps to better understand the story behind the data. The latter consists of building predictive models based on trends and descriptive analysis results, thus informing future decisions on operational, organizational, and business issues.
Visualization: These tools and techniques help users interpret analytics results, thus making this task easier for the human brain (i.e., by combining types of graphs, using colors, mixing reports with text and numbers, etc.). Visualization skills are intended to enable anyone, whether a data scientist or an owner or manager, to quickly and easily understand the meaning of the new insights generated.
A smart data analytics toolbox should be filled with cloud analytics tools, which allow organizations to consolidate data from different areas and departments (e.g., sales, marketing, human resources, finance) and thus obtain a unified view of the firm’s key figures. Taken together, the visualization, prediction, and scenario modeling tools provide all sorts of unique insights across the organization.
11.2 Methods and Technologies
A robust technological architecture that supports data analytics in the tourism firms should include several levels:
The level of the data source systems, from which data is extracted, transformed, and loaded (ETL) in the data warehouse or data lake.
The data integration-presentation level, where data is combined, manipulated, cleaned, and validated.
The analysis level, where multidimensional queries and optimized analytics are performed.
The visualization level, where data is presented to users using data mining techniques, statistical analysis, and other analytics technologies.
The most used methods and technologies at each level are discussed below.
11.2.1 Data source level
One of the biggest challenges facing organizations seeking to move forward with advanced data analytics is how to automatically collect massive amounts of data in non-standard formats and where to store them for further processing. This issue becomes even more critical when the organization must combine different and heterogeneous data sources (both internal and external), as data integration and quality issues arise. Nearly 70% of the time organizations spend on data analytics initiatives has to do with identifying, cleaning, and integrating data. “Good” data is often difficult to locate because it is scattered across many applications and systems, and must be reformatted to make it easier to analyze and update (Chessell et al., 2014). In short, data collection for analytics is often a heavy workload for the teams in charge to provide the right quality data within the organization.
To address these challenges, many organizations implement data lake solutions. The idea of a data lake is quite simple: it is about putting the data in a data repository in its original format, thus eliminating the tasks and costs of transformation before loading it. Once the data is loaded into the data lake, anyone in the organization can access it whenever they need to for research and reporting. The data lake’s ability to store and process vast amounts of highly varied data at low cost has made it the perfect place to perform ETL operations and meet the needs for greater agility pursued by smart organizations (Fang, 2015).
Data lakes are different from data warehouses (Table 11.1). These are meant to consolidate data from many different sources and create a single version of the truth. A data warehouse is a highly structured system with a data model that must be carefully designed before loading the data, because if you want to change it later, it is complicated and time consuming. A data warehouse typically works in batches and is ready to support thousands of simultaneous accesses from users who create reports or perform analysis.
| Characteristic | Data warehouse | Date lake |
|---|---|---|
| Data | Relational from transactional |
Non-relational from websites, |
| Schema | Designed in advance of data |
Written at the time of analysis |
| Performance/cost | Faster query results with higher |
Faster query results with low |
| Data quality | Curated data |
Data that may or may not be |
| Users | Business analysts |
Business analysts, data scientists, |
| Analytics | Batch reporting, business |
Machine learning, predictive |
On the other hand, data lakes are centralized repositories that can store structured and unstructured data at any scale in raw format, without the need to transform the data beforehand. They are closely related to the Apache Hadoop ecosystem of open source solutions, which is a popular framework because it provides a cost-effective and technologically sound way to meet the challenges of Big Data analytics in business firms. Data lakes support different types of analytics, from simple dashboards and visualizations to Big Data processing and machine learning at a lower cost. However, data lakes also have some drawbacks. One of the most important is its inability to determine the quality of the data, and the risks associated with data security and access control, as data is often loaded into the data lake without content monitoring. In terms of performance, data lakes and data warehouses offer similar metrics.
As we can see, the data lake and the data warehouse serve different needs and use cases, so the tourism firm may need both types of storage solutions as it moves through its smart transformation journey. That said, can the data warehouse and data lake work together? Yes, they can. This can be achieved by converting the firm’s data storage system into a hybrid framework consisting of a data warehouse and a data lake. This way the firm extends the capabilities of the data warehouse by allowing data from the data lake to feed the queries that users perform against the data warehouse. With such an architecture, data sourcing and analytics become transparent to end users, as the data system itself determines which data is used to answer each query.
11.2.2 Integration and presentation level
Probably the second most difficult question that data and analytics-centric organizations must answer (after how to extract and integrate data for processing) is how to extract “useful” insights from data to support better decisionmaking. Data mining allows firms to understand the patterns that are hidden in large volumes of data (i.e., patterns in users’ web browsing, patterns in past purchase transactions, etc.). This knowledge is highly valuable for firms because it can help them plan and launch new marketing campaigns quickly, and to know if the firm’s products and services are attractive enough for customers or if the firm needs new suppliers or partners.
Data mining can be applied to many types of data, such as database data (e.g., relational databases, NoSQL databases), data in data warehouses, data streams, spatio-temporal data, time series, IoT data, etc. (F. Chen et al., 2015). One of the richest data sources that tourism firms can apply data mining techniques to is e-commerce, as it injects many data records into data warehouses (e.g., customer data, product data, billing data, etc.) that can be exploited to extract valuable knowledge for the firm. Some of the main data mining techniques available to the tourism firm are discussed below.
Classification: It is the process of finding a set of functions (or attributes) that describe classes of data, to accurately predict the class of an object whose class is unknown. Classification is important in decision-making processes. It can be used, for example, to identify customer segments with low, medium, or high credit risk.
Clustering: It is an unsupervised learning method that analyzes data objects without even considering a previously known class model. Clustering uses algorithms that divide the data into meaningful groups so that the patterns in one group are similar and the patterns in other groups are different. For example, a search engine may group billions of web pages into different clusters, such as news, reviews, videos, etc.
Association analysis: It is the discovery of (association) rules that show that certain attributes appear normally in a data set. This type of analysis generates a general and qualitative knowledge that can be very useful for decision-making processes, such as when analyzing data on commercial transactions, shopping baskets, etc.
Time series analysis: It encompasses a set of methods designed to analyze a set of temporal data objects (usually large volumes of data with high dimensionality and regularly updated) and extract relevant statistical significance and other features.
Outlier analysis: It seeks to find patterns in data that are different from the rest of the data set. These patterns normally contain information that is valuable in explaining the abnormal behavior of a system based on the recorded data of its operation.
These data mining techniques are often used in combination to try to extract more information and relevant knowledge from a specific data set. For example, association analysis is usually combined with clustering analysis techniques to provide insights into the combinations of products that were purchased by customers, thus encouraging customers to buy other related products that they may have forgotten or overlooked.
Other common data mining use cases include:
Monitoring and analysis of user behavior during web browsing to find similarities and browsing patterns that can be useful in designing more user-friendly websites that respond to user needs.
Analysis of the preferred content consulted by users to identify and group similar profiles to whom potentially interesting content should subsequently be offered through recommendation systems.
Analysis of online transactions to improve the accuracy of demand forecasts for a given product or service and optimize product recommendations to users.
There are also good examples of data mining use cases in destinations management, such as analyzing the needs of tourists to predict the performance of a certain product or service; the automation of operational decision-making processes; or the search for association rules between some phenomena linked to tourism and its spatial dimension (i.e., the relationship between the concentration of tourists in certain areas of the city and the consumption of certain products and services).
11.2.3 Analysis level
There are three main types of data analytics techniques that tourism firms can use to drive decision-making: descriptive, predictive, and prescriptive analytics. These methods become especially powerful when used together (Fig. 11.2).
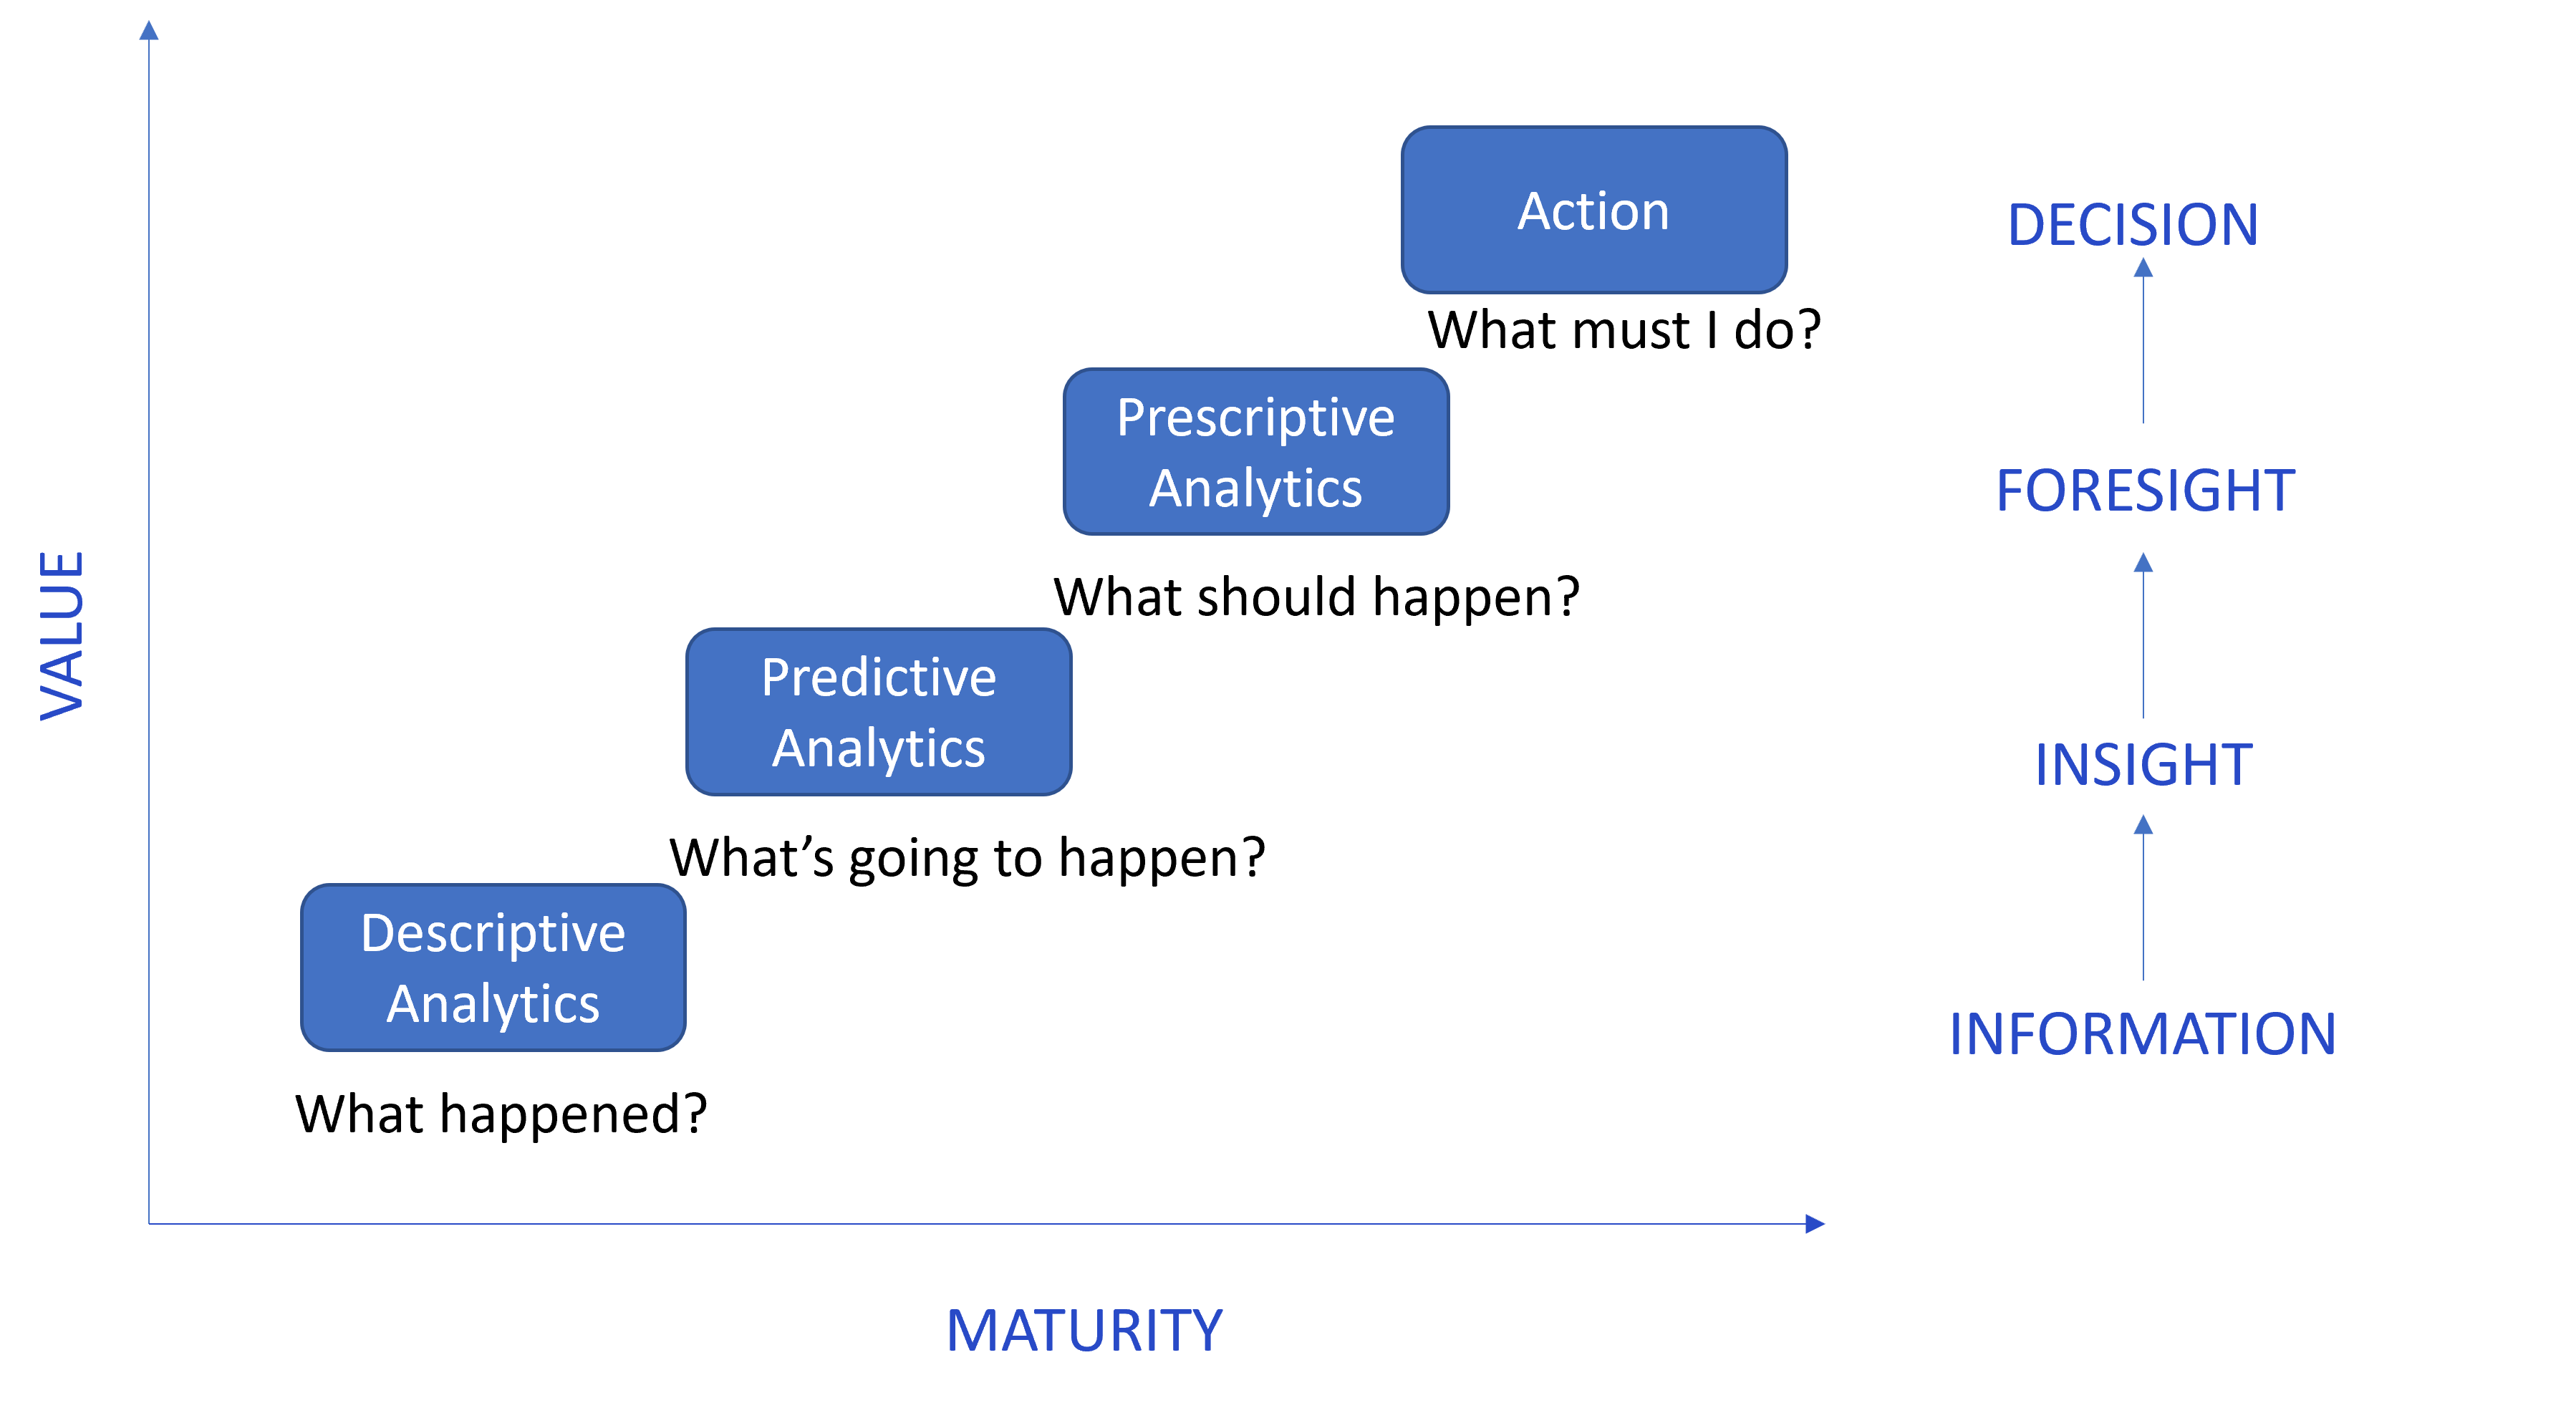
Descriptive analytics focuses on the analysis of historical data to understand what has happened in the past. It uses basic techniques based on data aggregation and data mining, therefore any findings are usually easy to understand for a business audience. Descriptive analytics typically displays outcomes using visual data representations such as graphs, charts, reports, and dashboards that can be easily aggregated to provide a clear picture of the operations of the firm (e.g., revenue reports, inventory reports, sales reports, etc.). Another applicable use case can be found in social media with tools such as Google Analytics and Facebook Audience Insights, which provide data groupings based on counts of events such as clicks and likes. Descriptive analytics is often the basis for delving into more complex analyses.
Predictive analytics is a more advanced analytics technique that provides information about what could happen in the future. It uses statistical models and machine learning methods to determine the probability of future outcomes based on historical data. Through predictive analytics new opportunities arise for decision-making through controlled experiments that can help inform key operational business processes (i.e., organizations can test different hypotheses and then analyze the results). This way business owners and managers can differentiate between causality and correlation and, therefore, improve the consistency of the results and the rigor of the business opportunities detected. For example, organizations are using predictive analytics to find behavior patterns in tourist movements; predict whether a product or service is going to be successful in the market; or optimize marketing campaigns by detecting cross-selling opportunities. One growing field within predictive analytics is deep learning, which mimics the decision-making process of the human brain to make even more sophisticated predictions.
A weakness of descriptive and predictive analytics methods is that they are often based on official records produced by public statistical organizations, whose reliability has sometimes been questioned due to the lack of harmonization of collection methods, the updating of the data, and the statistical procedures used. On other occasions, the data is based on surveys carried out in the “traditional” way, which means that many types of tourists go unnoticed. One potential solution to improve the quality of data for analytics is to harness the digital footprint left by millions of people online across technology platforms and connected devices. However, this does not ensure that the analytics will take into account all the tourists who travel to a certain place or consume the firm’s products and services.
Prescriptive analytics shows firms what should happen in the future or which option is the best among several alternatives. These techniques use a variety of statistical and mathematical methods that are applied to a variety of descriptive and predictive data. Prescriptive algorithms detect possible decision patterns that could have different consequences for the business. Through prescriptive analytics owners and managers can know in advance the possible repercussions of certain decisions and decide what is the best course of action before putting them into practice, thus reducing the costs of making mistakes. Prescriptive analytics can guide the organization in the management and allocation of resources more efficiently and effectively, since it uses optimization engines and statistical methods that allow millions of possible alternatives to be analyzed fast and the best decision to be recommended.
Last but not least, modern data analytics techniques require knowledge of some computer programming language, and database management systems to get the most out of it. However, the workforce of tourism firms does not always have these skills and capabilities. Similarly, firms require information systems that are well designed, organized, and managed. At times, tourism firms, especially smaller ones, will need to consider establishing collaborations with other firms and stakeholders, both within the tourism ecosystem and externally, to overcome these difficulties and have access to the personal, technological, and managerial resources necessary to make Big Data analytics a reality.
11.2.3.1 Machine learning
A particularly relevant set of methods and algorithms that is often confused with data mining is machine learning. This is actually not that surprising, because both data mining and machine learning use algorithms to discover patterns in data, analyze correlations, and extract insights from unstructured data. However, although there are many people who assimilate them, the outcomes they provide are different.
While data mining aims to extract patterns from large amounts of data, machine learning is an artificial intelligence that allows a system to learn from data rather than through programming. In other words, data mining relies on human intervention and determines an outcome based on the collected data, whereas machine learning trains an algorithm to perform complex tasks without relying on human intervention, so that as it ingests more training data it can learn and generate more accurate models based on that data. After training, when the model is fed an input, the machine learning algorithm will output a forecast based on the data used to train the model. Table 11.2 shows a summary of some of the most common predictive algorithms used in data analytics.
| Algorithm | Rationales |
|---|---|
| Linear regression | Supervised learning technique that helps model linear relationships between a dependent variable and one or more independent variables |
| k-nearest neighbors regression | Supervised learning technique that searches the observations |
| Logistic regression | Method that estimates the probability of a binary qualitative variable as a function of one or more quantitative independent variables (or predictors) |
| Bayesian networks | Probabilistic graphical model that allows the representation of the |
| Decision trees | Predictive model of decisions and their possible consequences in |
| Artificial neural networks | Predictive model in the form of a graph of nodes that emulates the behavior of neurons in the brain |
Machine learning techniques are essentially used to make predictions in supervised, unsupervised, and reinforcement learning environments (Noor & Haneef, 2020). Supervised learning is performed on training data; i.e., the machine uses some input data that has been previously labeled or classified for learning. Labeled data contains associated information in the form of a label, tag, or class, which gives them a significant meaning. For example, an image of a woman with a tag that identifies it as an “image of a woman”.
Unsupervised learning is performed with training data that does not have associated classes, tags, or labels to describe it; therefore, it needs to be grouped based on similarity. For example, an image of a woman that does not have a title that allows the machine to understand that it is an “image of a woman”. Unlabeled data can be photos, videos, or audio without a title or explanation. Social networks are usually analyzed using unsupervised learning techniques as social data is unstructured.
Reinforcement learning differs from the other types of learning because the system is not trained on data, but instead learns by trial and error as it interacts with the changing environment. Every time the system performs an action, it gets feedback in the form of “punishment” or “reward”, so a sequence of decisions that are correct will reinforce the process, since it better solves the problem.
11.2.3.2 Deep learning
Over the last decade, the increased availability of computing hardware that works in parallel, advances in machine learning algorithms, and the availability of labeled data have led to the renaissance of artificial neural networks. Deep learning is a machine learning method that consists of complex neural networks made up of three or more layers that iteratively learn from data. Over time, “neurons” iteration makes systems based on deep learning “smarter” and capable of uncovering hidden information, relationships, and trends, thus uncovering new opportunities, from consumer preferences to optimization of key marketing processes. Deep learning automates much of the mining process, removing some of the human intervention that is often required. It also allows the use of large data sets, which makes it work better with unstructured data. A deep learning model typically requires more data to improve its accuracy, compared to a regular machine learning model.
Since 2012, the world has witnessed an unprecedented interest in the use of deep learning techniques to solve an increasingly wide range of complex problems related to vision and spoken and written language. Today, practical applications of deep learning can be found in social media (e.g., object recognition in photos) and on smart devices (e.g., Alexa or Siri). Google has more than 1000 deep learning projects currently in development across all of its major products, including Google Search, Android, Gmail, translation, Maps, YouTube, and self-driving cars. Another example is DeepMind, which is a deep learning program that learns to play dozens of Atari games as well as (or better than) humans without being given specific instructions on how to do it. This program, trained differently, became AlphaGo, which defeated the GO board game champion in 2016.
Deep learning is a field at the forefront of research initiatives and funding programs to improve artificial intelligence. It has become virtually a prerequisite for all entrepreneurs building sophisticated software applications, such as those that incorporate natural language processing and vision (Parloff, 2016). There seems to be no end to these developments, as today almost anyone has access to free software and researchers are focusing their efforts on new and more powerful algorithms that lead to cumulative learning, including the not-so-distant possibility that smart computers can write new programs themselves.
11.2.3.3 Sentiment analysis
Sentiment analysis is a subfield of natural language processing (NLP) that allows text to be automatically classified by valence. With the help of sentiment analysis techniques it is possible to examine texts that contain explicit consumer opinions about firms, products/services, brands, events, or any other topic that interests people (Bazzaz Abkenar et al., 2021; Kauffmann et al., 2019). The importance of sentiment analysis stems from its ability to understand the polarity of sentiment in large volumes of text (i.e., classify reviews as positive or negative). For example, sentiment analysis can help determine the attributes of a product or service that should be improved, how customer services can be improved, how to design better marketing campaigns, etc. Sentiment analysis can also be used to rank customers or users based on their opinions, or to improve recommendation systems using positive and negative customer feedback.
The three most common methods used today for sentiment analysis are:
Lexicon-based methods: use a set of predefined word lists, corpus, and dictionaries (e.g., SentiWordNet, Affective Lexicon, SenticNet) to extract subjectivity and polarity from opinions and comments.
Learning-based methods: use machine learning algorithms (both supervised and unsupervised) to classify texts into positive or negative classes.
Hybrids: combine lexical-based and learning-based approaches.
Sentiment analysis can be applied at these three different levels (Z. Chen et al., 2021):
At the document level, the goal is to determine the general opinion about a particular entity, such as a product, hotel, tourist destination, etc.
At the sentence level, the polarity of opinions is analyzed further by dividing a document into sentences that can contain different opinions and are classified into positive or negative classes.
At an aspect level, which seeks to recognize expressions of sentiment and identify different opinions about an entity when there is a variety of attributes. For example, what are the most negative terms that dissatisfied business customers use during their stay in a hotel.
Sentiment analysis shares many of the same problems as NPL. In some domains or cultural contexts a word or expression may have an opposite meaning; there are sarcastic phrases that may express a sentiment that is the opposite of that indicated by their grammatical structure; there may be sentences that do not use sentiment words but contain sentiment information, etc. (Jandail & Ratan, 2014). Moreover, there is a bottleneck in sentiment analysis due to the scarcity of dictionaries and tools in different languages. Most of the resources are only available in English and there is not enough corpus for languages like Chinese, Spanish, French, and others (Bazzaz Abkenar et al., 2021).
Another major challenge is fake reviews, which render platforms and consumers unable to tell the difference between a real review and a fake one. When a customer wants to buy a product/service online, it is very common to spend time reviewing the ratings made by previous customers. The more positive reviews the product/service has, the more likely it is that the customer will decide to make a purchase. This confronts tourism firms with the difficult task of striking a balance between promoting online reviews while providing useful and truthful information that drives consumer decision-making. Unfortunately, although there are commercial algorithms that are capable of detecting these fake reviews in increasingly precise and sophisticated ways (i.e., systems that analyze both reviews and reviewers), it is very difficult to detect with absolute certainty whether a review is fake or not. Sometimes this situation is exploited by organizations and individuals to use spammers (or even bots) who submit huge number of fake reviews that increase the popularity of their product or discredit their competitors’ products. These deceptive practices are known as “review spam”.
11.3 Visualization level
Data visualization is the graphic representation of information and data. Data visualization tools provide a way to understand historical series, trends, outliers, and patterns in data by using visual elements such as charts, tables, and maps. They are essential when working with Big Data analytics and to support data-driven decisions. Good visualization always tells a story, removes noise from data, and highlights the information that is most useful, such as trends and outliers. However, getting a good visualization isn’t as easy as just creating a chart and embellishing it. Effective data visualization is a delicate balancing act between form and function (Tableau, 2022).
Some of the most frequent types of data visualization techniques used today are the following:
Univariate analysis: A single feature of the data is used to analyze almost all of its properties (e.g., distribution plots, box-and-whisker plots, violin plots, etc.).
Bivariate analysis: Data is presented graphically comparing two variables (e.g., line plots, bar plot, scatter plot, etc.).
Multivariate analysis: Data sets with more than three variables are represented graphically (e.g., scatterplot matrix, hyperbox, trellis displays, etc.). It is the most challenging visualization method compared to the others.
11.5 Big Data, Artificial Intelligence, and Analytics
The accelerated development of Big Data and analytics has meant that conventional algorithms and data processing software are no longer capable of handling large and complex amounts of data. As a result, many organizations have chosen to combine the use of Big Data, data analytics and artificial intelligence (AI) to make the most of the potential offered by Big Data and make tourism firms smarter and more innovative. The combined use of these technologies generates important synergies, since AI requires Big Data to learn and improve decision-making processes, and Big Data leverages AI to extract better insights from data analytics. In other words, by combining massive amounts of data with the ability of machines to develop human-like intelligence, it becomes possible to harness the power of predictive analytics to extract high-value information for the business and set up the basis for the adoption of the data-driven organizational model. AI can help in all phases of the Big Data and data analytics life cycle, including identifying potential connections between data sets, automatically exploring data without human intervention, and accelerating modeling of data. From the consumer’s perspective, Big Data analytics and AI (BDAI) can bring closer the ultimate personalization of the tourist experience and enrich it before, during and after the trip. Meanwhile, from the perspective of the tourism firm, BDAI promises to increase revenues and economic benefits.
BDAI allows firms to better forecast demand, using sophisticated algorithms to process structured and unstructured data. Other BDAI-related techniques, such as neural networks, classification trees, and regression, can be used to predict customer loyalty through the identification of customer attraction characteristics (Samara et al., 2020). BDAI can also help tourism firms create products and services at lower cost and with higher quality, mainly through automation, robotics, and digital augmented processes. Using BDAI, it is possible to speed up or even replace repetitive tasks, as well as reduce the number of errors made in the provision of services (e.g., room assignment, tourist itinerary planning, etc.).
Another valuable utility of BDAI is the ability to promote products and services at the right price to the right audience with the right messages (Samara et al., 2020). Thanks to BDAI systems it is possible for firms to set an optimal price for a given customer, automatically identifying purchase intentions, and improving customer satisfaction. This increases the customer’s intention to increase loyalty to the firm or to buy the firm’s products/services and, by extension, for the firm to increase its revenue. Many hotels and airlines around the world have already shown interest in using BDAI for strategic revenue management and capturing customer preferences.
On the other hand, BDAI methods are behind the possibility of targeting accurate advertising and promotional messages to customers, offering personalized information based on context and location, thus meeting customer requirements. This makes it possible for firms to design individualized marketing campaigns and increase ad “click-through rates” using BDAI. In other cases, BDAI supports customer recommendation systems that provide customization capabilities to web-based applications.
11.6 Implementation Challenges
Firms that evolve in the adoption of data analytics are better prepared to turn the challenges of smart transformation into opportunities. The more datadriven a firm is, the better financial and operational results it typically has, so analytics has competitive value that is directly related to firm performance (Zeng & Glaister, 2018). However, tourism firms face considerable challenges when it comes to implementing analytics-driven management and creating value from it, making it necessary for owners and managers to understand the nature of these challenges, why they arise, and how organizations can address them. A tool that can contribute to that understanding is the maturity process of implementing data analytics in business organizations. Data analytics maturity generally depends on the degree of analytical skills organizations have and to what extent they have been transformed using analytics. Some authors describe maturity in three levels of capabilities with respect to the analytics implementation process: aspirational, experienced, and transformed (LaValle et al., 2011):
At the aspirational level are organizations that focus on data analytics to improve efficiency or reduce costs (i.e., by automating existing processes). These types of organizations generally have few of the core components necessary to incorporate or act on analytical insights, such as people, processes, and tools.
Once the organization gains some experience with analytics after having successfully implemented several projects in the aspirational phase, it will seek to go beyond mere operational efficiency and cost reduction. These organizations strive to develop better ways to collect data and generate insights from analytics with an eye towards driving effective improvements at all levels of the organization.
At the transformed level, organizations have gained substantial experience in applying analytics across a wide range of functions and decision-making. Possibly they have already automated an important part of their operations through the effective use of analytical insights and are no longer so concerned with efficiency and cost reduction. They prefer to use analytics to optimize processes, manage their material and human resources, and create differential advantages that increase customer profitability and ROI.
Interestingly, and contrary to popular opinion, the main challenges firms face when starting with analytics are not related to getting the right data or technologies, but to cultural and management barriers, as there is usually a lack of understanding of how to use analytics to improve business (LaValle et al., 2011). Business owners and managers as leaders will need to interpret and communicate the complex knowledge that results from the application of data analytics, so that the organization can absorb its meaning as quickly as possible and contribute to successful decision-making.
11.6.1 Leadership and direction
Owners and managers are likely to find it difficult to move from making decisions based on intuition and personal experience to making them based on data, especially when that data often contradicts their own intuition or conventional wisdom in business management. For this reason, it is essential that the firm has a specific strategic direction before making an “opportunistic” use of data analytics, otherwise the efforts will end up stalling and resources will be wasted. Not to mention that an image of mistrust will be created about the true value that analytics can have for the organization.
It is very important that owner and managers are convinced of the value of analytics and its potential to improve management. Only in this way can they become its main promoters. It’s all too easy to lose focus when outcomes are uncertain and seem distant; therefore, unless the leader has been through a similar process before and understands the pitfalls, he or she may not be prepared to give the firm the boost it needs and keep it going for the long haul. Business leaders should learn all they can about how to lead and manage data analytics initiatives and how they can help the organization maximize value creation through analytics. Implementing an agile approach to developing data analytics projects can be a very good way for owners and managers to help the firm achieve the benefits of analytics more quickly and effectively and, in the process, get the stakeholders to learn and be part of the firm’s objectives.
11.7 The need for agility
Firms apply data analytics to solve business problems in highly varied and complex contexts that are changing at an ever-increasing rate. This often leads to firms engaging in so many different IT and analytics initiatives that management becomes chaotic. Each project has a different sponsor, goals, and funding sources, which poses the challenge of how to get all these initiatives up and running together. Moreover, when firms try to integrate analytical tools and technologies, they find themselves in an environment plagued by contradictions and inconsistencies that affect data structures, technologies, and processes.
Having reached this point, how can the firm address all these challenges? In a challenging scenario like this, the firm requires some guiding principles that assist the execution of analytics initiatives in a decentralized manner, but without giving up a governance model at the organizational level that avoids lack of coordination and entering into total chaos (Kemp, 2014). When the firm gets equipped with a governance model that is consistent and well designed, it ensures that there will be a balance between short-term and long-term analytics initiatives, and that it will have enough discipline to maintain the course. If the organization adds effective leadership to the above and a standardized architecture of systems and analytical processes consistent with the structure of the organization, then the firm as a whole will be on the right track to be more agile and flexible. From that moment on, the firm will have an easier time integrating the new data sources, technologies, and analytical processes that are necessary to mature in smart transformation. Notwithstanding, business owners and managers should never give up on developing an agile culture in the firm, though it will require significant time and organizational resources.
11.8 Implementation
Data analytics is a huge effort that leaves little time and few resources to capitalize on, so analytics initiatives often stall before they deliver results. All too often organizations succumb to the temptation to first gather all the available data before starting to perform analytics on it, without even thinking about whether it is reliable and what kind of value they will be able to extract from it. Instead, organizations should start at the end, first making explicit what kind of insights they expect to generate from analytics and what questions they want to answer, before moving on to identify the data they will need. By putting the expected insights and key questions first, organizations can then focus on tackling specific problems and using specific data and analytics without spending time guessing. Once the insights are gained and the questions answered, the organization will be closer to recognizing the gaps that exist in its capabilities, resources, and business processes.
As the firm gains experience with analytics in particular business units or management functions, it will start seeking to broaden the scope of the results and make more advanced use of these capabilities. Sometimes the creation of a centralized analytics unit (i.e., center of excellence, center of competence, or similar) is a mechanism that can bring together increasingly advanced analytics capabilities within the organization and lead the implementation of an analytics governance framework by setting priorities and standards.
So, where can the organization begin?
If the organization is at an aspirational level, owners and managers might be better off trying to gather the best people and enough resources to start one (or a few) analytics initiatives that can deliver effective, fast, and visible results. These initiatives should focus on some of the main business challenges that everyone recognizes as key to the organization and that can be addressed through analytics. Next, the available data with which to respond to the challenge will have to be collected, as well as choosing an appropriate analytical technique. Once the results have been obtained, they must be communicated to the rest of the organization, highlighting the value they generate and the potential for improvement for the firm if progress continues along this line.
If the firm is at an experienced level, it will have been adding new capabilities and achieving some success with analytics from the aspirational level (e.g., in finance, marketing, customer service, etc.), so now it’s time to focus on the key problems of the organization and extend the use of analytical decision-making to additional functions. To achieve this, it is highly recommended that the different departments of the firm establish collaborations that promote the creation of value for the business without compromising the work and needs of each one. At this stage of the analytics implementation, the firm could consider preparing an agenda or roadmap that identifies the practices and tools necessary to achieve an effective development of analytics in the organization. This agenda should have the adherence of those in charge of business strategies and those who manage data and analytical tools, otherwise each department or unit may end up exploring new developments independently, making it more difficult for the organization to realize the business benefits promised by analytics.
If the organization is at a transformed level, it will be in a position to start reaping the benefits of everything learned so far and apply all the lessons learned to other fields and functions with minimal changes. The firm may need to decide at this stage whether to continue to extend the value of analytics to all levels of the organization or, instead, delve into specific challenges, such as the development of scenarios and simulations, the application of analytics to business processes, the creation of specific dashboards and scorecards, or the use of more advanced analytics techniques. In either case, the organization should be committed to innovative improvements in the way analytics are used and continue to demonstrate new ways to help improve business performance.
11.9 Benefits
Data analytics provides great benefits that can be relevant to all levels of the organization. When data from all departments is consolidated and integrated into a single information repository and everyone is synchronized in the analytics process, the following benefits may begin to unlock:
Data-driven decisions: With data analytics, firms can start making smarter decisions, which basically means decisions that are backed by data. For example, the firm can explain certain phenomena and trends that have the most impact on the business and thus design better marketing campaigns, create new products and services, make changes to the budgets, etc.
Accessible knowledge: Data analytics allows the firm to collect vast amounts of data that is difficult to interpret and prepare visualizations that are easy to understand. The insights so produced will be much more accessible to members of the organization and, when used by more employees, the innovative potential of the organization can be significantly improved.
Scenario modeling: Through predictive analytics, firms can start building models to identify trends and patterns that help shed more light on their future. In the past, these abilities were reserved for a few specialists who had the knowledge and tools to exploit them. However, with modern data analytics tools, users can generate models without prior knowledge of algorithms or data science, increasing the ability to pose business scenarios, build models, and experiment with them.
Augmented capabilities: When machine learning and AI are combined with data analytics tools and capabilities, the potential to create value from data soars even further. This augmented analytics is distinguished by its ability to self-learn and adapt to large amounts of data and by automating processes and decision-making without human intervention.
11.10 Discussion Questions
What is the maturity level that tourism firms have reached in relation to the implementation of data analytics? Is this level above or below other service industries?
What analytical method is most used by tourism firms today? Why?
What is/are the data source(s) most currently used by tourism firms to feed analytics? What other data sources have potential for the tourism firm?
Which stage of the data analytics workflow is the most critical from the tourism firm point of view? Why?
What opportunities does machine learning offer to improve decision-making in tourism firms?
What role does owners and managers’ leadership play in extracting value from data through analytics?
What kind of data visualization techniques are most valuable to tourism firms?
11.4 Social Media Analytics
Social media analytics (SMA) is about extracting useful insights from social media data by collecting, cleaning, analyzing, summarizing, and visualizing data, with the aim of helping organizations and individuals to improve their decisions in different spheres of life. Traditionally, data on consumer behaviors and interests was collected through questionnaires (still widely used), but with the rise and popularity of social media it is now possible to collect vast amounts of data on consumer behavior. In this vein, social networks (e.g., Facebook), microblogs (e.g., Twitter), and media-sharing platforms (e.g., YouTube, Instagram) are platforms where online users are not only consumers, but also producers of content and social data that can be exploited using Big Data techniques (Sebei et al., 2018). The most popular social media provide application programming interfaces (APIs) (e.g., Facebook API, Twitter API) through which data analysts can send queries and extract large amounts of relevant data that can be later converted into useful knowledge for firms. When data is not accessible via APIs, web crawlers can be used to crawl social platforms and extract the desired data.
Since social media data is unstructured and produced in large quantities, traditional analytics techniques are no longer capable of processing it at the scale of volume, speed, and variety that is generated. This raises the need to develop new technologies that help improve the capacity and performance of traditional analytical techniques and achieve reliable insights. The combination of Big Data technologies with SMA techniques, known as Social Big Data, have enormous potential to extract value that is useful for the business (Sebei et al., 2018). Social media platforms themselves are a clear example of Big Data sources, since they are characterized by an exponential growth of large volumes of heterogeneous data (e.g., text, photos, videos, audio), thus making the application of SMA something natural.
Tourism activities and tourism firms have been strongly influenced by social media in the last decade as more and more tourism consumers join every day. SMA in tourism uses ICT to collect, process, analyze, and visualize data, and transform it into useful knowledge that serves to improve both tourism products and services and the tourism experience (Viñan-Ludeña, 2019). The insights extracted from social media are essential today for tourism firms that seek to identify new business opportunities, find hidden risks, optimize their performance, and increase their competitive edge. For this reason, tourism social media are an ideal field of application of SMA with great potential ahead.
11.4.1 Social media data
Social media data can be categorized into three different types: user-generated content (UGC), device-generated content (DGC), and transactional data. Let’s review each of them in more detail below.
11.4.1.1 User-generated content (UGC)
UGC mainly includes two types of online data: text data and photo data. Text data includes a wide variety of tourism-related information such as reviews, recommendations, and experiences in which tourists talk about their satisfaction with products and services on social media platforms, travel blogs, and booking sites (e.g., Tripadvisor, Facebook, Booking, Expedia, Ctrip, Twitter, etc.). Photo data published by tourists on social platforms contains very rich information, such as location, time, or comments, which can be used to analyze the behavior of tourists on a trip, describe their profile, and know the routes most traveled and the duration and places visited on their trips.
11.4.1.2 Device-generated content (DGC)
DGC includes GPS data, mobile network data, roaming data, Bluetooth data, and Wi-Fi data. GPS data is global and quite accurate compared to other technologies, as well as relatively easy to obtain and inexpensive. With GPS data tourism firms can analyze the spatial and temporal behavior of users who use mobile devices with integrated GPS. For example, firms can identify the trajectory of tourists, model tourist routes to predict the behavior and plans of tourists in places, segment users, and offer itinerary recommendations considering the information collected from weather stations.
Mobile network roaming data with its great coverage and rich information can be useful to provide new perspectives for tourism research. Although the exploitation of roaming data has just begun, many destinations use this data for the management of tourist flows and the spatial distribution of visitors, loyalty, and marketing actions, optimization of travel times etc. However, acquiring this data is difficult because it can lead to privacy issues by monitoring users, thus limiting its use.
Bluetooth data is generated on mobile devices carried by tourists that can be detected by Bluetooth sensors. Bluetooth technology can reveal the individual behavior of a large number of tourists and provide valuable information about their location and the route traveled. However, due to the limited reception range of Bluetooth data, the number of applications is limited to very specific areas or planned tourism activities (Z. Chen et al., 2021). Wi-Fi technology surpasses Bluetooth technology by allowing greater spatial coverage through wireless access points that facilitate monitoring of tourist behavior. Just like Bluetooth data, Wi-Fi data introduces privacy issues with user data.
11.4.1.3 Transactional data
Transactional data comes from two sources: website search data and online transaction data. Firms can use the traces that users leave each time they perform an online search through a search engine to learn about the online behavior of tourists, understand what tourists pay attention to, and know what the online purchase decision-making process is like. This data can also be valuable in predicting the traffic to a certain tourist place, or the number of customers to a hotel (e.g., using Google Trends, Baidu Index).
Data from other tourism-related transactions, such as online reservations, ticketing, and online purchase of travel products, are important sources for analytics. For example, a hotel website registers data such as reservations and online purchases from its guests, has data on room occupancy, and knows data on consumables such as electricity, water, and waste, which can be valuable in helping owners and managers to improve hotel management. When a tourist makes a purchase of a travel product/service with a credit card, the data is also recorded and stored, and can be valuable for analyzing the tourist’s purchasing behavior and designing a personalized experience.
11.4.2 SMA methods
SMA examines vast amounts of data available on social media platforms through advanced analytics techniques. These techniques reveal hidden patterns, discover unspecified correlations, and generate valuable insights not possible through other traditional analytical techniques. Data sets from social platforms are growing so fast and are so complex that getting meaningful insights from this huge amount of data, opinions, and sentiments is a challenge for any organization. As a result, owners and managers must recognize the need for advanced technological tools and infrastructures in addition to analytical techniques (Mirzaalian & Halpenny, 2019). The SMA workflow uses a combination of techniques that range from web crawling, NLP with machine learning, and statistical methods.
Web crawling technology is used to extract implicit information from travel-related textual data at the collection stage. Methods used in data preparation and analysis depend on the purpose and scope of the analysis, and include data cleansing, tokenization, word stemming, and part-of-speech tagging (POST). Some multifunction tools can handle these data processing tasks, including WEKA (Waikato Environment for Knowledge Analysis), LingPipe, and TextBlob. Pattern discovery is also important in text data mining, including tasks such as sentiment analysis, text classification and summaries, statistical analysis, dependency modeling, and latent Dirichlet assignment (LDA) (Z. Chen et al., 2021). Unlike text analytics, which is broad in scope and seeks to analyze textual data to extract machine-readable facts, sentiment analysis analyzes subjective opinions and feelings about a product/service using different analytic methods like NLP, computational linguistics, and analysis of UGC texts. Together, these methods allow organizations to monitor trending topics, mine opinions, and analyze georeferenced information. Specific uses in tourism include analyzing the differences between satisfied and dissatisfied customers, understanding preferred attributes of hotels, or identifying top hotel customer concerns.
When it comes to analyzing social media photos, the original online photo data is pre-processed using data cleansing and text extraction techniques to generate metadata. These metadata can then be grouped using clustering techniques by traveler origin, travel time, type of tourist attractions, etc. With this information, the travel trajectory can be studied considering the sequence of points of interest and the time intervals between them to establish the travel route (spatial dimension) and the travel plans (temporary dimension). Next, techniques such as the Markov chain (a probabilistic method used to analyze sequences and determine if some sequence occur more frequently than others) can help predict the next destination of travelers and generate more detailed information about a likely travel route based on the visitor’s location (J. Li et al., 2018).
Owners and managers should keep in mind that choosing an analytics tool is an important responsibility that generally depends on the ease of use of the tool, the type of social media and data it supports, the speed of the process, the accuracy and frequency with which the tool is used, and how often it is updated by the manufacturer or supplier (Bazzaz Abkenar et al., 2021). In general, firms use the commercial tools available, but also the analytical tools provided by the social networks themselves, such as Google Analytics, Facebook Audience Insights, Instagram Insights, etc.
Last but not least, firms must interpret the results obtained from the analysis phase. For this, there are tools that help display two or three dimensions of social data, such as time, location, and other attributes. Geo-visualization is an especially useful tool to show the underlying network structure of data and content published on social media. However, as DGC data lacks information that can be linked to the user, the geographic visualization of social media content primarily focuses on UGC data (Z. Chen et al., 2021).
11.4.3 Applications
SMA can be useful in almost every tourism business management function where decisions are made that are influenced in some way by social trends (Noor & Haneef, 2020). When a firm analyzes data from social media to see if one of its products or services is gaining or losing popularity over time, monitors the health of its brand, or assesses the reasons why there are angry customers, it’s not just processing relevant information about the degree of satisfaction or dissatisfaction of people, but gathering first-hand knowledge about the trends and challenges present in a specific community, that of its customers and users.
Through SMA, firms can get timely feedback on what they are doing or plan to do and gain instant insight into the needs and interests of their customer base. Furthermore, the firm can compare its products/services with those of its competitors, identify its competitive advantages, predict the future of certain products, and establish effective strategies focused on its target community. This makes it easier for owners and managers to focus more on implementing new ideas, products and services that improve the ROI, and save time and effort in decisions when there is not much information about the target audience and the competitors.